1/8




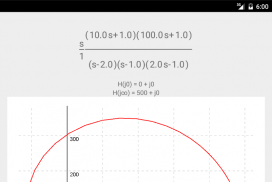
Nyquist plot
1K+Downloads
1MBSize
3.1(23-03-2018)Latest version
DetailsReviewsVersionsInfo
1/8

Description of Nyquist plot
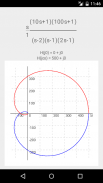
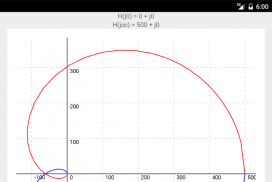
The Nyquist plot is a parametric plot of the frequency response of a system.
The Nyquist plot is used in electrical engineering and control theory.
This app shows the value of the transfer function for ω = 0 and ω = ∞.
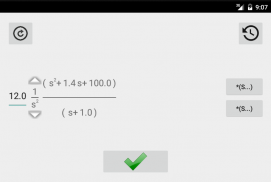
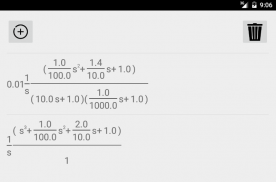
The app also contains a history of the 10 most recently used transfer functions. In case of complex transfer functions you don't have to reenter them.
No advertisement.
Nyquist plot - APK Information
APK Version: 3.1Package: com.hrca.nyquist.nyquistplotName: Nyquist plotSize: 1 MBDownloads: 56Version : 3.1Release Date: 2020-05-21 23:45:21Min Screen: SMALLSupported CPU:
Package ID: com.hrca.nyquist.nyquistplotSHA1 Signature: 18:F5:38:18:D7:9B:B9:C2:EC:44:17:1D:D2:02:23:F8:90:B7:B3:27Developer (CN): Hrvoje Juki?Organization (O): Local (L): OsijekCountry (C): HRState/City (ST): Osje?ko-BaranjskaPackage ID: com.hrca.nyquist.nyquistplotSHA1 Signature: 18:F5:38:18:D7:9B:B9:C2:EC:44:17:1D:D2:02:23:F8:90:B7:B3:27Developer (CN): Hrvoje Juki?Organization (O): Local (L): OsijekCountry (C): HRState/City (ST): Osje?ko-Baranjska
Latest Version of Nyquist plot
3.1
23/3/201856 downloads1 MB Size


